This guide describes the KeeN environment; the intended reader is the domain developer that uses the software to design, debug and test planning domains and related problems.
The first section deals with the installation procedure to follow to be able to use the software: installation of the prerequisites, of the environment itself, and some important post-installation options to set before the first usage.
The guide continues presenting a very simple example, meant to be followed step-by-step: this way, the reader is introduced to the most important features of KeeN with a hands-on approach.
After having tried the environment, a detailed description of the traditional editing features follows; this section can be used as a reference guide for all the features one might expect from a modern Integrated Development Environment.
Then, Graphical Modeling is introduced. The section presents the environment by offering a quick tour of the visual modeling capabilities through another example; after that, a complete guide of the graphical environment follows, including also the most advanced topics.
The guide then illustrates how to use planners in KeeN, so that they can run integrated in the development environment. Specialized executors, meant to execute the produced plans in the real or simulated world, are also briefly introduced.
Finally, a section on the Validation and Verification capabilities of KeeN marks the end of the guide.
KeeN is Open Source software released under the Eclipse Public License, version 1.0, and as such its source code can be downloaded from its GitHub repository.
Installation
The installation of KeeN is quite simple, as it only needs some small steps to be performed in a running Eclipse instance. Like many software packages however, it requires a number of prerequisites to be installed before it can be used.
Prerequisites
KeeN needs at least Eclipse and Java to be installed on the machine where it will be run. To enable additional features, such as Validation & Verification and the usage of a planner, additional software needs to be installed.
Basic Requirements
The following software requirements are the absolute minimum that are needed to be able to run KeeN, and are thus mandatory.
- Java
- KeeN requires a Java Virtual Machine (JRE) or a Java Development Toolkit (JDK), version 8 or better; the latter is generally preferred as it also enables Java development within Eclipse. Java can be downloaded from www.java.com. Users of operating systems other than Windows or macOS (for example, GNU/Linux) might be able to install a Java environment such as Oracle’s Java or OpenJDK using the package manager of their operating system.
- Eclipse
- KeeN was built on Eclipse Neon, and for this reason it is the recommended version to use; later versions might work as well, although untested, while previous versions are not supported. Eclipse can be downloaded from www.eclipse.org; while KeeN can be installed on any Eclipse edition, an inexperienced user might choose the “Eclipse IDE for Java Developers” edition if in doubt. As for the Java case, also for Eclipse there might be a version provided by the operating system vendor.
Other Requirements
These requirements are needed to enable other advanced features of KeeN. Even if they are not strictly necessary to run the software, their installation is recommended to use KeeN at its full capacity. It is not required that they be installed in advance: until they aren’t, however, some features will not work.
- EPSL Planner
- The Extensible Planning and Scheduling Library’s planner [COU2013, COU2016] is needed for the KeeN environment to generate plans, and for these plans to be subsequently verified. EPSL can be downloaded from http://pst.istc.cnr.it/epsl.
- Uppaal Tiga
- Uppaal Tiga is a tool to perform automatic synthesis of controllers for timed systems; it is used under-the-hood by KeeN to perform Domain Validation and Plan Verification. Uppaal Tiga can be downloaded from http://people.cs.aau.dk/~adavid/tiga, and the recommended version is 0.18.
- Plan2Tiga
- Plan2Tiga [CO2015] is a tool implementing the encoding of time-flexible plans into networks of Timed Game Automata (TGA), in the format expected by Uppaal Tiga. KeeN leverages Plan2Tiga to encode a plan generated by the EPSL planner in a format suitable for Uppaal Tiga to check whether the corresponding plan is dynamically controllable or not. Plan2Tiga can be downloaded from http://cialdea.dia.uniroma3.it/plan2tiga/.
KeeN Installation
Once the prerequisites are installed, it is possible to install KeeN as a set of Eclipse plugins. The following sections assume the Eclipse platform is running on the local computer.
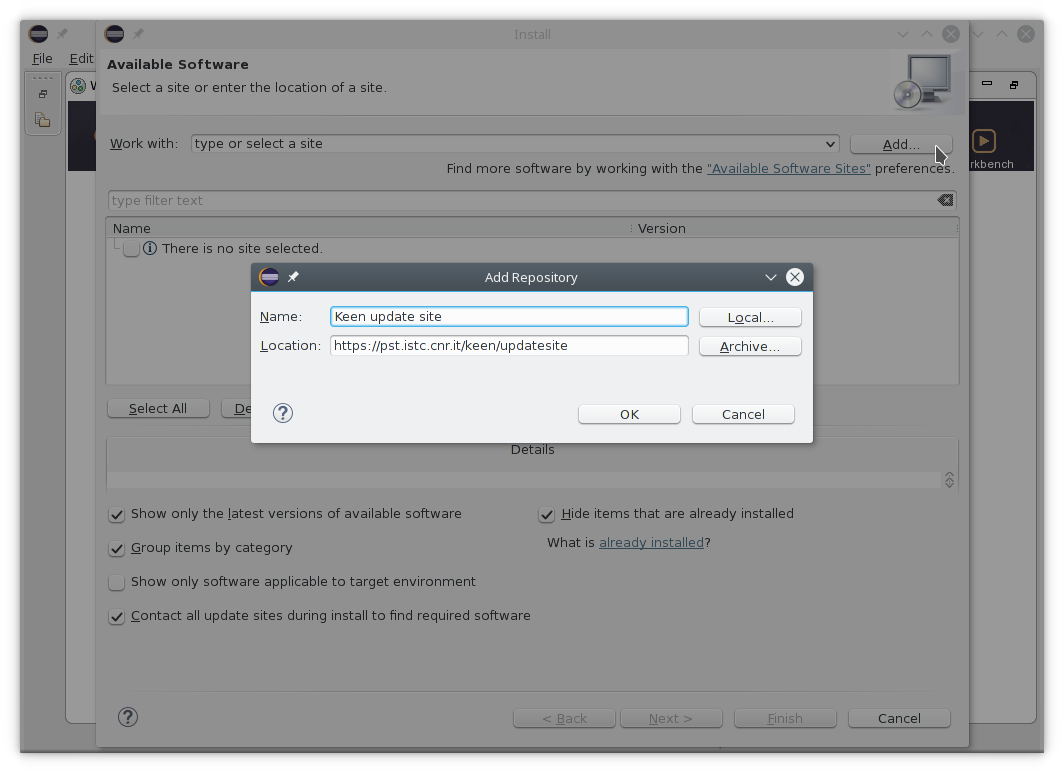
Addition of the Update Site
KeeN is distributed as a set of plugins from an update site; an update site is a remote location describing some pieces of software (plugins) which can be installed in Eclipse. Adding the KeeN update site to the list of known sites enables the platform to install the software referenced therein; moreover, future KeeN updates will be published to the update site, allowing Eclipse to notify the user when an updated version is available.
To add the KeeN update site, select the “Install New Software…” item from the “Help” menu of Eclipse. In the window that is then shown, click on the “Add…” button to the right of “Work with”, in the upper part of the window. The location of the update site is https://pst.istc.cnr.it/keen/updatesite, and the user is free to use whatever name they prefer (for example, “KeeN update site”).
Installation of the Plugins
The just added update site should now be selected in the upper part of the “Available Software” window. Just below, the various plugins that made up the KeeN system are displayed, under the Keen category.
The user may choose to install all the available plugins or only a subset, according to their needs; if a selected plugin requires another, non selected one, the latter will be installed anyhow to satisfy the dependency. Some of the plugins require additional (and sometimes large) third-party dependencies that will be automatically installed during the process. The following description details the features provided by each of the KeeN plugins.
- Keen DDL support
- enables KeeN to handle the DDL language, and must always be installed because is needed by all other plugins. It provides the textual editing features related to the DDL language, and all the support features one reasonably expects in Eclipse, such as code assist, syntax highlighting, outline view and so on. This plugin requires the Xtext Runtime.
- Keen Graphical Modeling
- contains the graphical modeling functionality of KeeN. This plugin requires “Keen DDL support” and “Keen Xtext-Sirius integration”, and depends on a number of third-party dependencies such as GMF, Sirius, Xtext, EMF Compare and the Eclipse Layout Kernel.
- Keen EPSL Support
- supports the usage of the EPSL planner to generate plans. To successfully use this plugin, the EPSL planner must be installed by the user (see section Other Requirements). This plugin requires “Keen DDL support”.
- Keen Validation
- enables KeeN to perform Domain Validation and Plan Verification. Uppaal Tiga is necessary for both the activities, while Plan2Tiga is additionally required for Plan Verification. Section Other Requirements explains how to install these prerequisites. This plugin requires “Keen DDL support” and “Keen EPSL Support”.
- Keen Xtext-Sirius integration
- is a service plugin needed by “Keen Graphical Modeling” to enable *Round-Trip Engineering* in KeeN. It requires the Sirius Runtime.
Once the desired plugins are selected, click on “Next” button to start the installation process; a review page showing the elements that are to be installed will be shown; upon clicking on “Next” again the user will be prompted to accept the Eclipse Public License under which all the software components are released; after accepting and clicking on “Finish”, the installation process will start and the software components will begin to be downloaded.
When installation is completed, a dialog will warn the user about the need of restarting Eclipse to be able to use the newly installed software; it is recommended to follow the advice and restart.
If for some reason Eclipse fails to start after the new software installation, the user might try to clean up the Eclipse installation by passing the -clean command line argument to the Eclipse program: it is enough to open a terminal/command prompt window, or the launcher of the operating system being used (for example the “Run” window in Microsoft Windows) and execute the command eclipse -clean. If the problem is solved, future launches of Eclipse will not need the -clean argument to be specified again.
Post-installation Settings
Even if not strictly required to use the software, there are a number of preferences that the user might want to set before using KeeN; while it is always possible to come back and change them at any time, it might me desirable to set some in advance.
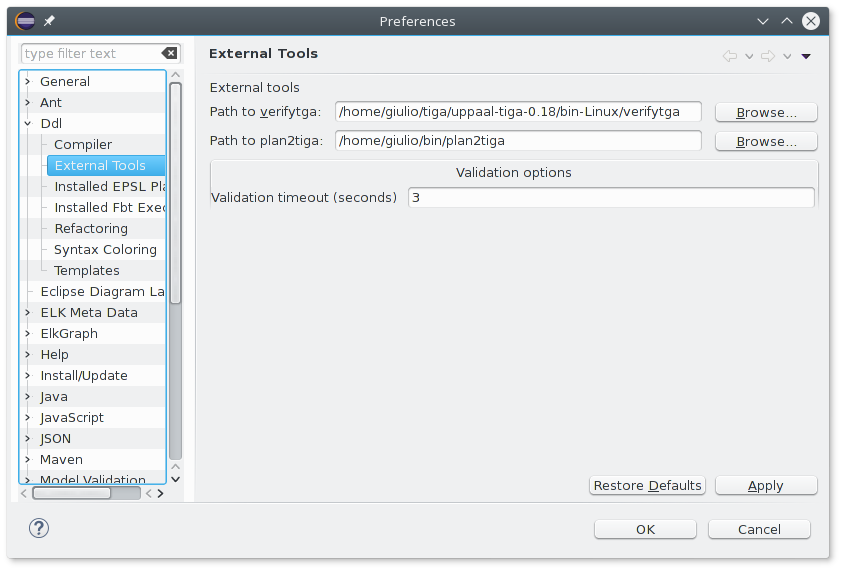
To access the KeeN settings, select “Preferences” from the “Window” menu (or from the “Eclipse” menu if using a Mac) and then select the desired item under the “Ddl” category in the left pane.
- External tools
- Use this panel to specify the paths to the installations of Uppaal Tiga and Plan2Tiga, which are needed to perform Domain Validation and Plan Verification. The program `verifytga` belongs to Uppaal Tiga, and is usually located inside the `bin-*` subdirectory (e.g. `bin-Linux`, `bin-Win32` and so on) of the Uppaal Tiga distribution. The program `plan2tiga` can be downloaded from the Plan2Tiga website (see section Other Requirements).
- Installed EPSL Planners
- Use this section to add a number of EPSL installations to use when generating plans; although a number of installations can be specified, most users will only add one. If no EPSL planner is added at this time, it will be required to do so the first time a plan is to be generated.
First Steps
Let’s discuss here a very simple domain whose implementation, detailed in the following paragraphs, is meant to quickly introduce some of the features of KeeN to the reader; the domain under consideration is that of a traffic light, whose color is allowed to go from green to yellow and then to red.
An Example Domain
First of all, Eclipse needs to be launched. If needed, switch to the workbench clicking on “Workbench” in the upper-right part of the main window.
Then, click on “New” and then “Project” from the “File” menu. Search for “Ddl” and choose “Ddl Project”. Click “Next” and choose a name for the project, (for example, “Sample”) and click Finish. Eclipse might warn that this kind of project is associated with the Keen perspective, asking whether the user wants to open that perspective: it is recommended to answer “Yes” and open indeed the Keen perspective.
Eclipse generates an example domain (see below) containing some basic definitions that can be used as a starting point to define more complex domains. In the example there is a component type defined, NewComponentType, consisting of a single value, Value1 without any parameter. The type is then used to instantiate one component, NewComponent. A synchronization block on the NewComponent’s timeline then follows, but there are no constraints defined yet.
 1  /*
 2   * This is an example domain
 3   */
 4
 5  DOMAIN NewDomain
 6  {
 7      TEMPORAL_MODULE temporal_module = [0, 200], 300;
 8
 9      //Component types
10
11      COMP_TYPE SingletonStateVariable NewComponentType (
12              Value1())
13      {
14              VALUE Value1() [1, +INF]
15              MEETS {
16                      //Insert type constraints here...
17              }
18      }
19
20      // Components
21
22      COMPONENT NewComponent {FLEXIBLE timeline(planner_specific_rule) } : NewComponentType;
23
24      // Synchronizations
25
26      SYNCHRONIZE NewComponent.timeline
27      {
28              VALUE Value1()
29              {
30                      //Insert timeline constraints here...
31              }
32      }
33  }
As one might expect, the words of the example file are highlighted using different colors (syntax coloring) according to the language rules; on the right, the Outline shows a summarized view of the structure of the domain being edited, updated in real time as modifications are made. Two areas in the domain code are underlined in yellow, and a warning sign next to the beginning of each area marks a spot where, if moving the mouse to, a pop up appears explaining the reason of the warning: in this case, they are related to an empty transition constraint and synchronization block, respectively. The same warnings are referenced in the Problems view, at the bottom of the main window.
First Customizations
To keep things simple, let’s delete the synchronizations part of the domain for now, and focus instead on the component type definition; the reader might observe how, upon deletion, the Outline is being updated and one of the two warnings disappears.
Since it’s skeleton has already been prepared by Eclipse, it’s possible to reuse the NewComponentType type definition to implement the component type for the traffic light we aim to model; the component type needs three values to represent the three possible light states (red, green, yellow), so let’s replace the value “Value1()” on line 12 of the previous listing with “Red(), Green(), Yellow()”. This change introduced a compilation error, as Eclipse immediately detects: the preexisting transition constraint references the value Value1, which was just deleted: to fix the problem, it’s enough to replace Value1 with Red on the line bearing the error.
Having defined which are the possible states, it’s now necessary to specify how to transition between them: that is, it is necessary to define the possible transition constraints that lead from one state to another. It is immediately clear that the possible transitions should be:
-
Red → Green -
Green → Yellow -
Yellow → Red
To implement the first one, it’s sufficient to insert “Green();” where the comment “//Insert type constraints here...” currently is. To implement the remaining two constraints, one might just copy and paste the four lines of code of the current constraint and to adjust the values as needed, but it’s also possible to use code assist to be assisted in the process.
To insert the constraint for Green, do the following:
-
Insert a new line after the right brace closing the previous constraint.
-
Press Control+space to invoke content assist.
-
Select “transition constraint”.
-
In the generated piece of code, the focus should be on the name of the source value, after the
VALUEkeyword. TypeGreenand press Enter. -
The cursor is then moved to the transition constraint body: press Control+space again to invoke code assist and choose the appropriate value (Yellow).
-
Complete inserting the brackets and the final semicolon so that the last line reads “
Yellow();”.
To model the last transition constraint, just repeat the steps above changing values where needed.
As a last step for this initial version of the model, it’s necessary to set some duration values for the states that the traffic light may assume: let’s say the green light is on for 20 seconds, then the yellow light for 10 seconds, and then the red one for 30 seconds; these values can be added to the model by replacing the [1, +INF] intervals next to each value with a fixed interval - that is, an interval whose lower and upper bound are the same. After this last change, the domain should now look as the one in the following listing.
/*
 * This is an example domain
 */

DOMAIN NewDomain
{
	TEMPORAL_MODULE temporal_module = [0, 200], 300;

	//Component types

	COMP_TYPE SingletonStateVariable NewComponentType (
		Red(), Green(), Yellow())
	{
		VALUE Red() [30, 30]
		MEETS {
			Green();
		}
		VALUE Green() [20, 20]
		MEETS {
			Yellow();
		}
		VALUE Yellow() [10, 10]
		MEETS {
			Red();
		}
	}

	// Components

	COMPONENT NewComponent {FLEXIBLE timeline(planner_specific_rule) } : NewComponentType;
}
A Glance at the Diagram View
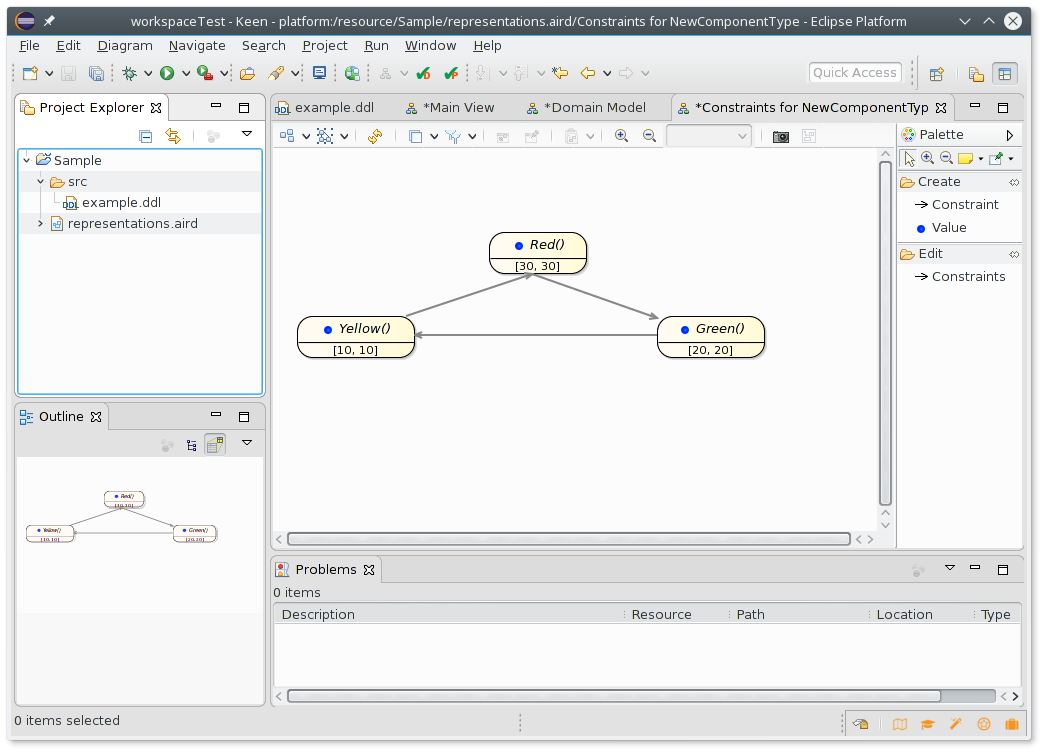
To conclude this introductory section, it is possible to display what has been textually modeled by the means of a graphical representation; to switch to the diagrams view select “Open Diagram” from the “Navigate” menu, or click the icon with the same name in the KeeN toolbar. Eclipse will ask a name for the main diagram, “Main View” by default, and will then show this diagram containing the just defined domain. The reader is encouraged to double click on “Domain model” and then on the only component type defined to open the transition constraints view, showing the transitions between the three possible traffic light states graphically. The result, after some minor layout adjustment (e.g. moving the Outline view to the bottom-left part of the window and laying out the three states with a different arrangement) should resemble what shown in the following figure.
Traditional Editing
The previous section briefly showed some of the features of KeeN, which are here further detailed. The following sections, after naming some key Eclipse concepts, describe the user interface elements that can be used to visualize information and to interact with the system. The operations related to the editing of the domains are then presented, together with a description of the relevant user settings. To conclude, the traffic light domain example previously introduced is further expanded to show some of KeeN features discussed here.
Projects and Files, Natures and Perspectives
KeeN is an environment that eases the development of domains to solve planning problems, whose source code is ultimately encoded in the DDL language in the form of computer files. There are two kind of files, bearing specific extensions in their names and meant to fulfill different purposes:
- Ddl files,
- identified by the
.ddlfile extension, are the domain definition files: they encode a planning domain and all the information about the components, their types, the transition state rules and the synchronization rules that bind each component to the others. - Pdl files
- are the problem definition files: they refer to an existing domain and contain the known facts about the problem under discussion (for example, the initial conditions) and the goals that the planner must try to fulfill. They are identified by the
.pdlfile extension.
As it might be familiar to those already using the Eclipse platform, files need to be contained in a project, which might be thought as a collection of related resources: for this reason, it is forbidden for two .ddl files belonging to the same project to define the same domain name, an event that would result in a duplicate identifier error to be reported by the system.
A project itself has one or more natures: in the case of KeeN, the DDL projects created by the New Project Wizard (see section An Example Domain) automatically have the DDL nature. The DDL nature makes it possible to associate DDL-specific settings to the project and handle launch configurations for planners and executors.
Finally, a nature might determine which is the best perspective to be used to work on a project: a perspective defines which buttons and menu items are available, and which views are shown by default. As the reader might have already noticed when following the steps described in section An Example Domain, a DDL project is normally associated to the KeeN perspective, which provides the DDL-specific user-interface elements that make up KeeN.
Toolbars and Menus
The KeeN perspective (introduced in section Projects and Files, Natures and Perspectives) adds a group in the Eclipse toolbar consisting in three buttons:
-
The “Open Diagram” button, which is used to switch to the Diagram View (see section Graphical Modeling). A diagram will be created the first time it is tried to be opened: in that case, Eclipse will ask the user for the name to assign to the diagram, suggesting a default one. On the right of the button, a drop-down menu provides shortcuts to open the already defined diagrams.
-
The “Validate Domain” button, used to perform Domain Validation. Domain Validation is discussed in section Domain Validation.
-
The “Verify Plan” button, that triggers plan verification. See section Plan Verification for details.
Additionally, “Open Diagram” is also available as a menu item under the standard Eclipse menu “Navigation”.
Syntax Coloring
Syntax coloring, or syntax highlighting, is the ability of the editor to use different colors and styles (e.g. bold, italic…) for different parts of the code it contains. Coloring is performed in (almost) real time as the user types, and allows to quickly identify the key part of the program or domain being edited, while sometimes also helping to recognize typing errors if the just-entered keyword is not highlighted as expected.
This feature is nowadays widely known and expected to be provided by almost any but the most basic editors, with Eclipse being not an exception; as one might expect and as already introduced in section First Steps, KeeN supports syntax coloring for the DDL language.
The Outline View
The Outline is another well-known feature of Eclipse (and other IDEs), consisting in a tree view of the syntactical structure of the file being edited. In KeeN, the Outline view shows all the most important elements of a domain, such as data types, component types with their values and transition constraints, and the components with their timelines and synchronizations.
By default, the selection on the Outline view is linked with the contents of the editor; that is, when selecting an element from the Outline view, the editor will scroll to the position where that element is defined in the domain, and vice versa: moving the cursor in the text editor changes the item currently selected in the Outline view. This behavior can be changed by clicking on the button “Link with Editor” in the toolbar of the Outline view.
Content Assist
Content assist is the ability of the editor to suggest code fragments that may be inserted at the cursor location: in other words, the editor is capable of providing context-sensitive proposals consisting of syntactically-valid pieces of code.
Content assist is invoked in Eclipse by pressing Control+space on the keyboard (unless the user has decided to assign a different key combination to this feature). Upon starting the action, a small pop up window is displayed, showing the possible keywords, variables or other syntactical elements that might be inserted at the current cursor position. By using the arrow keys on the keyboard and pressing the enter key, or by clicking with the mouse, the user can select the appropriate suggestion; alternatively, it is possible to start or continue typing to restrict the number of available suggestions, before choosing the desired one.
Besides suggesting simple syntactical elements, KeeN has also some built-in templates for typical, even if more complex, constructs: for example, it can generate the skeleton of a synchronization block or transition constraint, as shown earlier in section First Customizations. Templates also contain some placeholders for the values that the user needs to change: when the template code fragment is inserted in the editor, the cursor is positioned on the first placeholder for the user to edit; after pressing the Enter key, the cursor is moved to the next placeholder, and so on. Templates are recognizable because they are prefixed by a green circle mark and are listed as “name - description”, and are shown at the bottom of the proposal list.
Formatting
It is common to follow a particular style when writing programs or domain, consisting of rules about the amount of white space to use when indenting, when to use line breaks and so on. Sometimes, after editing a file multiple times, it is possible that a domain become incoherent with these rules: formatting, sometimes also known as “pretty printing”, helps to fix these situations by employing an uniform style.
Formatting is activated by pressing the key combination Control+Shift+F, or by right-clicking on the text and choosing Source and then Format from the pop-up menu; formatting is only performed on the selected text, unless there is no selection, the latter case being treated as if the whole document were selected.
Currently it is not possible to customize the formatting rules followed by KeeN.
Refactoring: Rename
KeeN supports one powerful refactoring action, Rename: it allows to change the name of an entity, being it a variable, a type, a component or whatever identifier, while also renaming all references to the previous name, even in different files. The direction of the rename operation is not unique: it is possible to rename an element by changing the name of a reference instead of operating on the location where the element is defined.
To use the rename refactoring, place the cursor on the name to change and press the combination Shift+Alt+R, or right click and select “Rename Element” from the pop-up menu: when typing in the new name the references will also be updated in real time. To conclude the rename action, press the Enter key.
Errors and Warnings
The ability of reporting errors and warnings to the user is fundamental for compilers. KeeN however, as other environments in the Eclipse platform, is able to perform most of the checks a compiler makes in (almost) real time: this means that errors are reported in the Problems view as soon as the user introduces them.
Errors and warnings are not only listed in the Problems view (where the user can choose to filter them according to various criteria), but their location in the code is signaled by marks on the right part of the editor, near the vertical scroll bar: clicking on a mark scrolls the editor to the position of the error, where the problematic text is underlined and another mark appears on the left; moving the mouse pointer over the mark shows the details of the error/warning.
User Settings
There are some aspects of KeeN that can be customized by changing some user preferences, some of which were already introduced in section Post-installation Settings.
The User settings can be changed by clicking on “Preferences” from the “Window” menu (or from the “Eclipse” menu if using a Mac), and then selecting the “Ddl” category. The available pages are:
- External Tools
- Here it is possible to set the paths for the external tools
verifytgaandplan2tigathat are used to perform Domain Validation and Plan Verification. See section Validation and Verification for further details. - Installed EPSL Planners
- In this page the user can specify the existing EPSL installations that must be known to the system. The EPSL installations, once added, can be referenced by the launch configurations that are used to generate plans for a domain/problem. See also section Planning later.
- Refactoring
- It contains two options regarding the behavior of the Rename refactoring.
- Syntax Coloring
- In this page it’s possible to change the color, font and style of all the syntactic elements that are recognized by syntax coloring (see also section Syntax Coloring.
- Templates
- Here it’s possible to create new templates to be used in Content assist (see section Content Assist), and to edit the existing ones.
The Example Domain, Continued
In this section the traffic light example domain, originally introduced in section First Steps, will be expanded to resemble a real world situation; the modified domain will describe two traffic lights in a crossroad, such that when one shows the green light the other one shows the red light, and vice versa. The process of modifying the domain will introduce some important constructs of the DDL language, synchronizations, and will show some of the capabilities of KeeN that were presented in the previous section. Finally, a problem definition file will be generated to describe the initial state of the world and the desired goal, so that a planner could show the transitions needed to reach that state.
The Components
As written earlier, two traffic lights needs to be modeled; this can be done by creating two components, that might be named TL1 and TL2, which are instances of the same component type. Since the New Project Wizard already created a new component, it’s enough to change its name from NewComponent to TL1. For the second traffic light, it’s possible to copy and paste the previous line while ensuring to change the name to TL2; alternatively, the new component can be generated by content assist (press Control+space, select “component” and fill in the name of the new component).
Now, both the components will be instances of NewComponentType, and they will both have a timeline each, named timeline; this is completely legal, but to better differentiate the two it’s advised to change their names to timeline1 and timeline2, respectively.
Renaming the Component Type
While the code written so far obeys to the syntactical rules imposed by the DDL language, the use of the name NewComponentType is questionable from a semantic point of view; a better name would certainly be TrafficLightType. Let’s use KeeN’s support to the Rename refactoring to change the name of the component type wherever it is used.
To do that, position the editor cursor on an occurrence of the word NewComponentType and press Shift+Alt+R (or right click and select “Rename Element” from the pop-up menu): a green rectangle will highlight the current word. Change the name from NewComponentType to TrafficLightType and press Enter when done: the component type name will be changed in the type definition and in the component declarations that define instances of that type.
Adding Synchronizations
Synchronization rules are used to bind values in some timelines to the ones of different timelines. In the case being examined, it’s necessary to add a rule specifying that when a traffic light becomes green, the other traffic light must become red (and vice versa): it is not necessary to specify other rules, because the transition from green to yellow is already handled by the transition constraints discussed in section First Customizations and is not directly dependent on the value of the other traffic light.
SYNCHRONIZE TL1.timeline1
{
	VALUE Green()
	{
		otherRed TL2.timeline2.Red();
		STARTS otherRed;
	}
}
Let’s write the rule from the point of view of the traffic light TL1 becoming green, for now.
-
After the component definitions, press Control+space and choose “Synchronization group” to insert a new synchronization group.
-
In the first placeholder (timeline), write the name of the timeline of the first traffic light (
TL1.timeline1); instead of writing directly, it is possible to press Control+space again and let Content assist show the available timelines, and choose the first one. -
By default, an empty synchronization was added on the value
Red, because it is the first value defined in the component type; let’s change that toGreeninstead -
In the synchronization body, declare the value of the other timeline that this value must be bound to: insert the line “
otherRed TL2.timeline2.Red();” to declare a variableotherRedrepresenting the valueRedon the timelinetimeline2of componentTL2. -
State that when this timeline
TL1.timeline1assumes the current value (Green), this causes the other timeline to assume theRedvalue: insert the line “STARTS otherRed;” below the one inserted before.
The synchronization code should now match the one of the listing above: it is expressing the rule that, when the timeline of the first traffic light assumes the Green value, this causes the timeline of the second traffic light to assume the Red value, at the same starting instant (hence the keyword STARTS).
To define the rule in the opposite direction, that is, that when the second traffic light becomes green, then the first one must become red, simply copy the generated block modifying accordingly.
The Problem Description File
The Problem Description File is used to describe the initial state of the system (the facts) and to define the planning goals that the planner must try to fulfill.
For the case under discussion, let’s assume that traffic light 1 is initially green, and consequently that traffic light 2 is initially red. To see the model working, one might ask the planner to show a sequence of states, observing that the two traffic lights change values as expected; hence, a possible goal might be “traffic light 2 must be yellow at some time”, which should make the planner show a plan in which traffic light 2 becomes green and then yellow, while traffic light 1 becomes yellow and then red.
To encode the initial state and the goal in the DDL language, a Problem Description File is needed. It can be created in KeeN following these steps:
-
In the same project of the
.ddlfile, right click on the folder that contains theexample.ddlfile and choose “New” and then “File”. -
In the dialog window that is shown, type a name for the new file, ending in
.pdl;example.pdlwill be fine. -
In the new file, insert an empty problem declaration that references the
NewDomaindomain, as this one:PROBLEM NewProblem (DOMAIN NewDomain) { } -
In the problem body, insert the fact that at the instant 0 the first traffic light is green; in DDL, this is expressed as
start1 <fact> TL1.timeline1.Green() AT [0,0] [1, +INF] [1, +INF]; -
In the next line, insert the fact that at instant 0 the second traffic light is green:
start2 <fact> TL2.timeline2.Red() AT [0,0] [1, +INF] [1, +INF]; -
Finally, state that the goal is that the second traffic light will be yellow at some time in the future:
end2 <goal> TL2.timeline.Yellow() AT [0,+INF] [1,+INF] [1,+INF];
PROBLEM NewProblem (DOMAIN NewDomain)
{
	start1 <fact> TL1.timeline1.Green() AT [0,0] [1, +INF] [1, +INF];
	start2 <fact> TL2.timeline2.Red() AT [0,0] [1, +INF] [1, +INF];

	end2 <goal> TL2.timeline2.Yellow() AT [0,+INF] [1,+INF] [1,+INF];
}
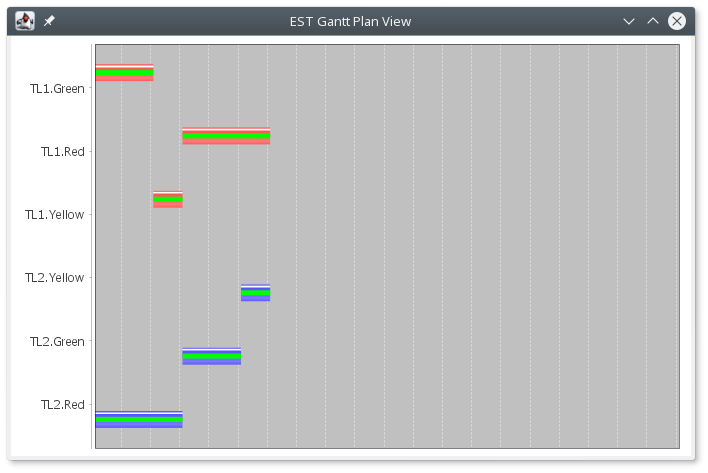
The final result is shown in the listing above. If the EPSL planner has been installed in the system, it is also possible to actually run the planner on the domain and program files and see the generated plan. The following figure shows the EPSL Gantt Plan View displaying the plan as a Gantt chart: in the last step, TL2 has the Yellow value, as per goal requirement; before that, the traffic light correctly transitions between the other states, and at the same time the TL1 traffic light performs its transitions while respecting the synchronization rules written in the domain.
Completing the Example
As a final touch, let’s rename the domain from NewDomain to TrafficLightDomain, and let’s delete the initial comment lines stating that it is an example domain. Switch to the example.ddl file and use the Rename refactoring to change the name of the domain from NewDomain to TrafficLightDomain. Then, delete the comment lines at the top of the file. The final result is as follows:
DOMAIN TrafficLightDomain
{
	TEMPORAL_MODULE temporal_module = [0, 200], 300;

	//Component types

	COMP_TYPE SingletonStateVariable TrafficLightType (
		Red(), Green(), Yellow())
	{
		VALUE Red() [30, 30]
		MEETS {
			Green();
		}
		VALUE Green() [20, 20]
		MEETS {
			Yellow();
		}
		VALUE Yellow() [10, 10]
		MEETS {
			Red();
		}
	}

	// Components

	COMPONENT TL1 {FLEXIBLE timeline1(planner_specific_rule) } : TrafficLightType;
	COMPONENT TL2 {FLEXIBLE timeline2(planner_specific_rule) } : TrafficLightType;

	SYNCHRONIZE TL1.timeline1
	{
		VALUE Green()
		{
			otherRed TL2.timeline2.Red();
			STARTS otherRed;
		}
	}
	SYNCHRONIZE TL2.timeline2
	{
		VALUE Green()
		{
			otherRed TL1.timeline1.Red();
			STARTS otherRed;
		}
	}
}
Graphical Modeling
Besides being used for traditional editing, KeeN supports the modeling of timeline-based planning domains by the means of diagrams; this, graphical modeling, enables to craft concepts and relations by selecting objects from a toolbar and connecting them in various ways, providing means to quickly sketch ideas visually and possibly refining and polishing the model when necessary, minimizing the need of typing code.
From a graphical model KeeN generates the equivalent code in the DDL language (Forward Engineering). But it can also do the opposite (Reverse Engineering), namely generating a graphical model from existing code; this feature is particularly helpful to explore and visualize existing models with the aim of better understanding them, or for documentation purposes.
The system can, however, do more than Forward Engineering and Reverse Engineering: it can perform Round-Trip Engineering, which is basically the ability of going back and forth between the textual and graphical models, making it possible to make some changes graphically and some others textually.
This section will introduce the graphical environment by the means of a small example. Then, a detailed description of the various diagrams will follow. Finally, some words about the additional features of the environment will close the section.
A Quick Tour
To get started with graphical modeling let’s consider an example domain, which was also described in [CCFO2011] and [COU2016]. In particular, our example will follow the one presented in [COU2016], with minor changes due to explanatory purposes. The domain here introduced is that of a space probe orbiting around a remote planet; the satellite can point its antenna towards the target planet and perform some sampling that leads to the production of scientific data, or it can point the antenna towards the Earth and use it to send the collected data back to the space mission control center. Transmission of data is not always possible, because the visibility of ground stations on planet Earth varies in time, and it must also taken into account that slewing, that is switching from the two different pointing modes (towards Earth or towards the target planet), takes some time. Finally, the satellite can be put in a special maintenance mode that needs an explicit procedure performed from earth for it to come back to normal operations, and as such is only marginally considered here.
Switching to Graphical Modeling
Similarly to what already done for the traffic light domain in section An Example Domain, let’s create a new DDL project via the New Project Wizard. In the generated example domain, delete everything inside the domain definition but the temporal module declaration.
Switch now to the graphical mode by clicking on the “Open Diagram” button in the toolbar, or by selecting “Open Diagram” from the “Navigate” menu. Eclipse will ask the name of the main diagram: the default, “Main View” is fine for the purposes of this section, so let’s click OK and go on. The system will display a first diagram, showing the NewDomain domain and its temporal module declaration, as defined in the DDL file.
Introducing Diagrams
In KeeN, there is not an unique diagram to represent all concepts that can be expressed in a DDL file; instead, there are different diagrams, or views, each concerned with the modeling of a certain aspect of the domain being considered: the Domain Model, the Component Diagram, the Transition Constraints, the Synchronization Diagram and finally the Main View, which is the “root diagram” just displayed that is used to represent the domain itself at the highest level.
In diagrams, elements (represented by blocks and connecting lines) can be created, moved and resized with the mouse, their properties can be edited and relationships can be established and deleted. A toolbar at the top of the diagram’s area hosts the buttons used to lay out, filter and style the elements, to zoom the area and to export images, while a palette on the right lets the user create or edit the diagram elements.
In the Main View just opened a domain and temporal module have already been defined, hence it is not possible to use the palette to define these elements; if starting from an empty file, though, that would have made sense. Instead of defining a new domain, let’s change something in the auto-generated one to fit it to what we aim to model:
-
Rename the domain to something more meaningful (for example,
SATELLITE): click on the domain name in the upper part of the domain block to start to edit it, change the name and then press the Enter key. -
Change the temporal module to use a slightly bigger interval: an horizon of 250 with 500 time points (a time point is thus 0.5 time units). Click on the appropriate part of the temporal module block to edit it to the desired value.
Modeling the Basic Concepts
To model a domain, it’s essential to define the types that will be used to instantiate the components that represent the key concepts of the system. The types must be defined in the domain model, which can be opened by double clicking on “Domain Model” inside the block representing the domain, in the Main View.
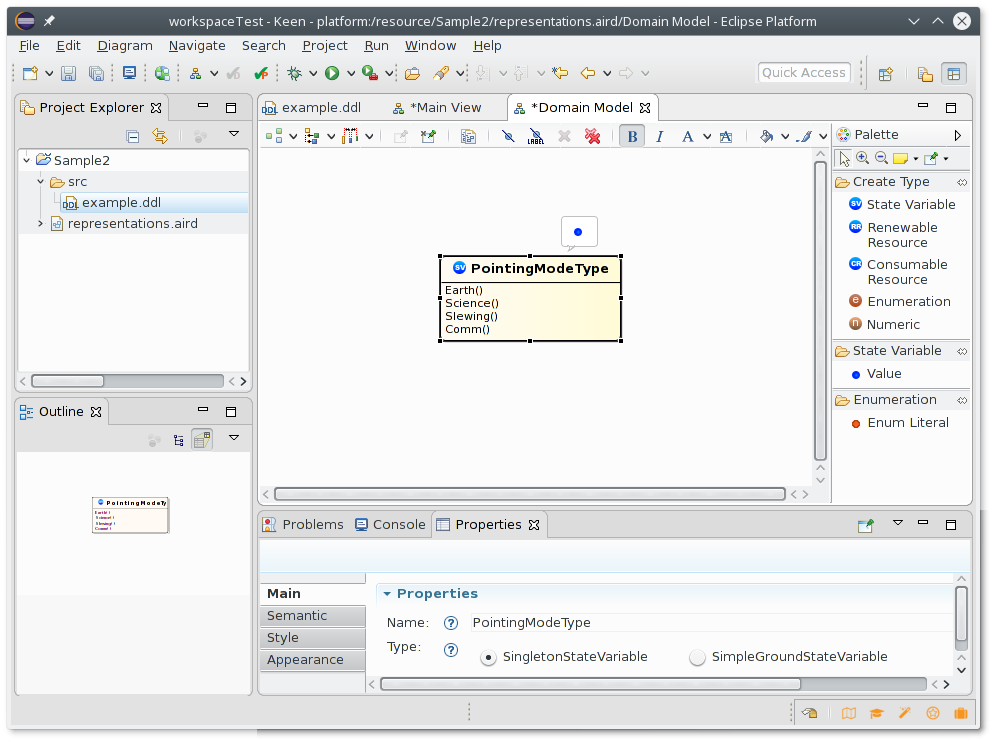
In the newly-created diagram, let’s define a type to represent the “Pointing Mode” concept: click on the “State Variable” item under the “Create Type” palette on the right, and click somewhere in the blank area of the diagram to create a new state variable type, then rename it to PointingModeType.
As mentioned before, the space probe might be:
-
facing Earth
-
collecting science data
-
slewing between the previous two states
-
communicating data back to Earth
To define the four possible values, move the mouse over the newly-defined PointingModeType type and click on the blue round mark icon (representing a new value) that pops up; repeat the process four times and name the values Earth, Science, Slewing, and Communicating respectively. The result should resemble the following figure.
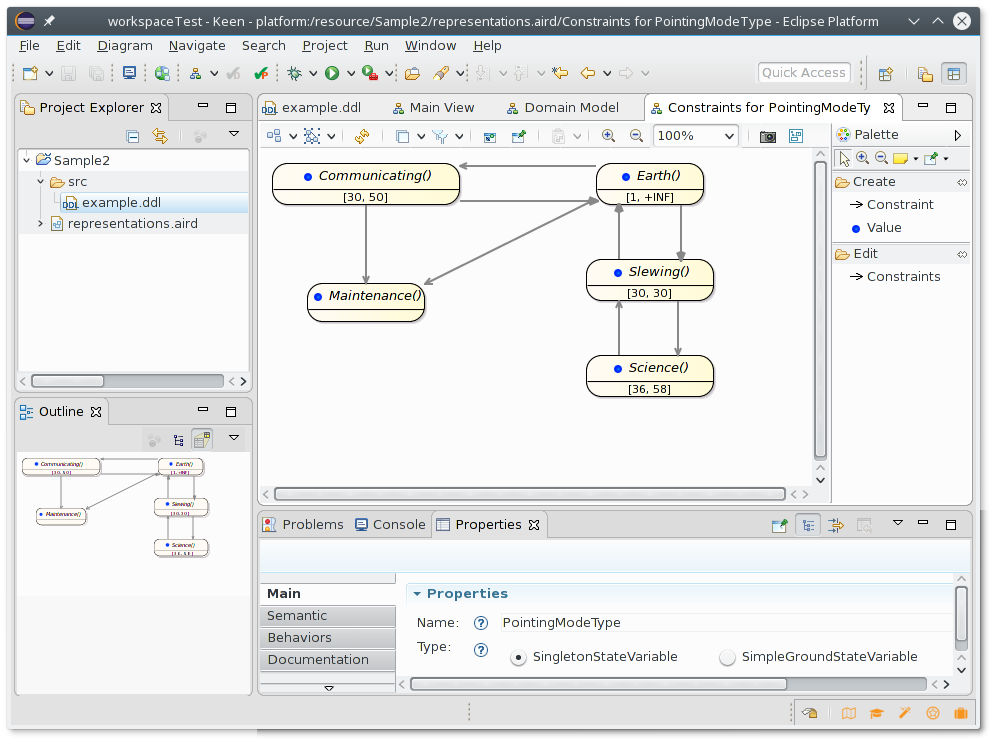
Double click now on an empty area inside the component type to switch to the transition constraints view. Here, let’s define the legal transitions between the states:
-
From
Earth, the satellite can startCommunicatingorSlewing. -
When finishing
Slewing, it can point towardsEarthor start collectingSciencedata. -
After collecting
Sciencedata, can only startSlewingagain. -
After finishing
Communicatingit will be left pointing towardsEarth.
To define these transitions, select the “Constraint” tool from the “Create” toolbar, and connect the different values respecting the directions written above; if necessary, move the blocks around to find the desired layout.
After having defined the possible transitions, let’s specify how long the satellite is allowed to remain in a state before having to transition to another one; this can be done by assigning an interval, expressed as a lower and upper bound, to each state having an outgoing transition. Let’s assume that:
-
the probe can be pointing towards
Earthforever:[1, +INF]. -
Slewingalways takes the same time, 30 minutes:[30, 30]. -
Communicatingcan take from 30 to 50 minutes:[30, 50]. -
collecting
Sciencedata usually takes a little longer than communicating those data:[36, 58].
To define these intervals, simply edit the interval ([0, +INF] by default) of each value as just specified.
As a final touch, the domain description mentioned a special maintenance mode that might only be unblocked by an instruction from Earth; let’s add a new Maintenance value that can be reached only from Earth and Communicating (since the probe must be facing Earth when in maintenance mode to be able to receive the unblock instruction). Let’s also consider the Maintenance state as a sink state (without any outgoing transitions), since there is no automated planning decision that can make it change its state without human intervention.
It is possible to add the Maintenance state from the current diagram, without having to go back to the domain view: simply move the mouse over the area where the new state is due to appear, and click on the icon that pops up to create the new state; then, draw the constraints from Earth and Communicating. The final result is depicted in the following figure.
Another important concept is the one of ground station visibility. It can be modeled by creating a new state variable type, GroundStationVisibilityType, having the values Visible and NotVisible and being obviously able to transition between the two. Let’s say that the minimum and maximum duration for a visibility window is 60 and 100, respectively, while the intervals of no visibility can last from as little as 1 minute to a maximum of 100 minutes. To model this type, go back to the Domain Model diagram and define a new state variable type; then, double click on an empty area inside the new block to define its states with their values and transitions.
Defining Components and Synchronizations
After having defined the component types, it’s time to instantiate the components themselves, and to define the synchronization rules between them.
On the right of the “Open Diagram” button in the main Eclipse toolbar there is a drop-down menu that can be used to navigate between all the existing diagrams: use that to go back to the Main View, then double click on “Component Diagram” to open the Component Diagram.
Let’s create the two components for the pointing mode and ground station visibility: move the mouse in an empty area and click on the component icon. Edit the name of the component so that it is PointingMode, type the semicolon character (“:”) and then press Control+space to invoke content assist; select the PointingModeType type and press the Enter key. Then, change the name of the timeline to a more meaningful one, pm. Repeat these steps to define a GroundStationVisibility component of type GroundStationVisibilityType, with a timeline named gv.
Now that the components are defined, let’s reason about the synchronization rules. One obvious constraint, as mentioned initially, is that communication of data back to Earth can only happen during a ground station visibility window. Let’s express this graphically:
-
Double click on
PointingMode’spmtimeline to open the Synchronization Diagram for that timeline -
In the diagram that opens, the available values from
PointingModeTypeare shown: let’s create a synchronization havingCommunicatingas trigger by moving the mouse over it and selecting the trigger icon that pops up. -
Having created the trigger, select “Synchronization” from the “Create” toolbar (or select it from the popup that appears moving the mouse on the trigger).
-
In the window that is displayed, select the value
Visiblebelonging to thegvtimeline of theGroundStationVisibilitycomponent. -
The new synchronization is created, but it’s by default a
MEETSrelation. Let’s change it to aDURINGrelation, unbounded: “DURING [0, +INF] [0, +INF]”.
Another constraint, not explicitly stated but dictated by common sense, is that it’s only possible to communicate data if those data has previously been acquired: in synchronization terms, it’s necessary to create a synchronization having Science (from pm timeline) as trigger and Communicating (from the same timeline) as target; in this case, the relation must be “BEFORE [0, +INF]”, stating that the acquisition phase must finish before the start of the communication phase, without particular bounds. To define this synchronization it’s only necessary to repeat the steps done for the previous one, changing what needs to be changed.
A Look at the Generated Code
After having modeled this domain graphically, let’s go back to the textual representation to see what has been generated so far; if the code looks untidy, just press Control+Shift+F to get it back to shape by using the format tool. The generated code should closely reflect what has been modeled graphically, encoded according to the rules of the DDL language.
The Diagrams
As explained in the previous section, the graphical editor of KeeN is focused around diagrams, and provides editors to create and adjust these graphical representations at will. All the different diagrams share some common characteristics due to the nature of the elements they display and because of the editor that is used to manage them. In this section, the diagrams and their user interface is described thoroughly. The reader might also consult the Sirius User Manual.
Anatomy of a Diagram Editor
A diagram view, as displayed in the previous figure, consists in different parts:
- The toolbar
- at the top, containing the buttons that result in some action to be performed on the diagram. The set of available buttons changes according to whether there is an active selection or not.
- The palette
- on the right, hosting the controls needed to create or edit the diagram’s elements (blocks, relationship lines, sub-items...), grouped in sections. Sometimes it is possible to create an object by just leaving the mouse pointer in an empty diagram area (to create a top-level element such a block) or over an existing element (to create a sub-item).
- The diagram area,
- occupying the most part of the view, which contains the diagram itself.
Besides these three parts, there are two other important views that are not strictly contained in the diagram view but are closely related: the Properties and the Outline views.
- The Properties
- view displays the properties of the selected elements, and can sometimes permit to change some advanced details that are not otherwise accessible without switching back to text mode. If it is not visible in the Eclipse Workbench, click on “Window” menu, then on “Show View” and finally on “Properties” (or “Other” if not found).
- The Outline
- was already introduced in section An Example Domain, but when editing diagrams it shows a zoomed-out version of the diagram instead of representing the file being edited as a tree as is the case of text-mode editing.
The next section will describe the toolbar, which groups together common actions that can be used in every diagram available in KeeN. Then, a detailed explanation of each provided diagram will follow.
The Toolbar
The toolbar, displayed in the top part of the diagram view, hosts different sets of buttons depending on whether some diagram elements are selected or not.
When there is no selection, it consists of these buttons:
- Arrange All
- It lays out the objects (excluding the pinned ones) trying to improve diagram readability by the means of a layout engine.
- Select All
- Selects all items or optionally only shapes or only connectors, if any of these options is chosen from the drop-down menu on the right.
- Refresh diagram
- Forces a refresh of the diagram from the underlying data.
- Layers
- This button can hide/show the layers in the diagram; different diagrams have different layers that group related elements: for example, the Domain Model has layers for State Variables, Resources, Parameters, and Dependencies, and the user can select to show only a subset of them.
- Filters
- Not currently implemented in KeeN.
- Show/Hide
- Can show or hide specific elements from the diagram, also using wildcards.
- Pin/Unpin
- Can be used to pin or unpin objects. Pinned objects are not moved when using the “Arrange all” action.
- Paste Format
- Can restore a previously-copied format (by the “Copy Format” action). Alternatively, only the layout or only the style can be restored using the drop-down menu.
- Zoom In/Zoom Out
- Allow to increase or decrease the zoom level, which can also be explicitly specified in the text input field on the right.
- Export diagram as image
- Can export the diagram in both raster (jpeg, png, bmp, gif) and vectorial (svg) image formats.
- Layouting Mode
- When activating Layouting Mode, some of the operations that would result in semantic changes are disabled: in other words, this mode can be used when it is desirable to change only graphical properties (position, size...) and accidental semantic changes are to be avoided. Not all changes are prevented though (for example, the user may change properties in the Properties View even when layouting mode is enabled).
When a graphical object is selected, the toolbar hosts these buttons:
- Arrange Selection
- It lays out the selected objects only.
- Alignment
- This button permits to align the selected elements (at least two objects must be selected for it to work); the exact way in which the elements are aligned depends on which action is chosen from the drop-down menu on the right.
- Distribute Centers/Gaps
- It allows to lay out the selected objects so that excess space is uniformly distributed among them; for this action to work, at least three objects need to be selected. The exact operation performed depends on the actual action that was clicked on in the drop-down menu.
- Pin/Unpin
- Pins or unpins the selected objects only instead of letting the user choose.
- Copy Format
- Copies the format of the selected elements so that it can later be restored by the means of the “Paste Format” command described earlier.
- Hide element
- Hides the selected elements. To restore the elements’ visibility, click on the “Show/Hide” button when no element is selected.
- Hide label
- Hides the label of the selected elements. To show a label afterwards, right click on the desired element and select “Show label” from the “Show/Hide” popup menu.
- Delete from Diagram
- Not implemented in KeeN: it is not possible to delete an element from the diagram only without changing the related textual representation.
- Delete from Model
- Deletes the selected object.
- Font buttons
- These controls lets the user override the default font settings for the selected elements.
- Fill Color, Line Color, Line Style
- These buttons can be used to change the color and line of the selected elements, if applicable.
- Set style to workspace image
- Replaces the currently selected element with an image chosen by the user.
- Reset style properties
- Reverts any user-made style customization to the default.
- Apply style
- When clicked, this button applies to the currently selected elements the customized style of the previously-selected element.
- Make height and width same size
- Makes the size of all selected elements equal to the size of the last selected element in the group.
- Auto Size
- Adjusts the selected elements’ size to fit their contents; from now on, automatically resizes them when their content is changed.
The Main View
The Main View is the root diagram of KeeN’s graphical representation, and can be created even on an empty DDL file by simply clicking on the “Open Diagram” icon on the main Eclipse toolbar. The palette allows to create the domain and its related temporal module, but it is not possible to have more than one domain or temporal module in a single file.
From the domain it’s possible to navigate to both the Domain Model and the Component Diagram by double-clicking the chosen area inside the object representing the domain.
The Domain Model Diagram
The Domain Model is the diagram used to define all data types in the domain of interest, while delegating the transition constraint editing to a different, specialized diagram (see section The Transition Constraints Diagram). It can be created from the Main View by clicking on “Domain Model” inside the block representing the domain.
By using the palette, or moving the mouse over an empty area, it’s possible to create the following element types:
- Enumerations and Numerics
- These are simple data types that can be used as parameter and variable types later on. Enumerations contain literals (Enum Literal button), while numeric types are defined by the means of their allowed interval, which can be defined by directly editing it in the graphical representation.
- State Variables
- A key concept in timeline-based planning, these are the types used to define the components later on. They have multiple possible values (Value button in the State Variable palette section): to specify arguments for a value, simply name the required types between the two brackets, separated by commas. For example:
Value1(speed, length, choice)
wherespeedandlengthmight be two numeric types, andchoicean enumerated type.
To define the legal transitions between the values, open a Transition Constraints Diagram by double-clicking on an empty area inside the desired State Variable Type. To edit the underlying type of state variable (that is, `SingletonStateVariable` or `SimpleGroundStateVariable`) it’s necessary to use the Properties View.
- Renewable and Consumable Resources
- These are types representing resources, renewable or consumable; their reference values can be directly changed in the editor. Consumable resources have a minimum and a maximum, and after being used need to be “filled” again; Renewable resources, instead, have a capacity which is only temporary decreased by an usage (e.g. they can be used to model space occupancy).
The Domain Model places its objects in different layers, which can be made visible or invisible by using the Layers button in the toolbar; they are State Variables, Resources, Parameters and Dependencies. By default, all layers but Dependencies are shown. Dependencies do exist when a state variable type references some other data type, e.g. because it uses parameters of a certain data type in a value, or inside the body of a transition constraint.
The Transition Constraints Diagram
The Transition Constraints Diagram is used to defined the legal transitions between two values (states) of a state variable type. It is created from the Domain Model, by double clicking in an empty area inside the block representing the desired state variable type.
This diagram shows all the values that were defined for the specified state variable type, but it also permits to create new ones (Value button in the palette); its main function though is defining the legal transitions.
To define a transition, create a constraint relationship between the two desired values, in the appropriate direction: click on “Constraint” in the “Create” palette, click on the source value and then on the destination value. When creating a constraint, it becomes possible to specify the minimum and maximum duration of the source value; the rationale behind this is that it makes no sense to define the allowed duration for a sink state: only when there is the possibility of exiting from that state it makes sense to specify how long that state is allowed to last.
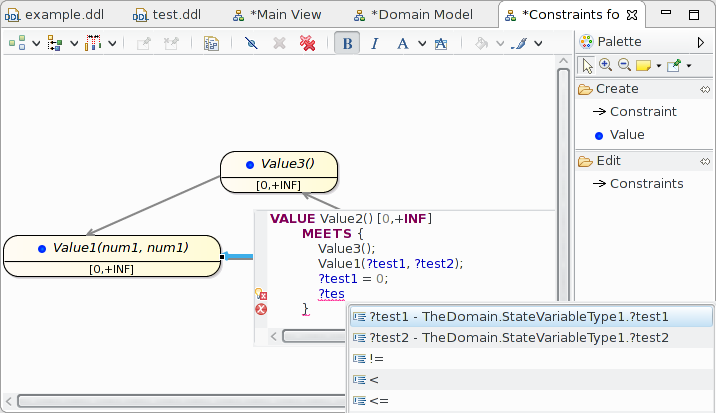
It is also possible to specify more complex constraints than just simple transitions; to do that, double click on the desired relationship, or select “Constraints” from the “Edit” palette, and click on the arrow line: a popup window (see the following figure) will be displayed allowing the user to edit the constraint code at will. The editing session can be terminated by pressing Control+Enter to confirm the changes, or by pressing Esc to undo them.
In the Transition Constraint Diagram it’s also possible to specify if a certain value is controllable or uncontrollable, that is, if the planner has the ability of deciding the duration of the event or if it can only assume that it will stay inside the given time bounds. The controllability can only be specified by the means of the Properties view, where the user can choose between Unspecified (in which case the behavior is determined by the planner), Controllable or Uncontrollable.
The Component Diagram
The Component Diagram is used to define the components, that is, instances of the types that were defined in the Domain Model, and their timelines. It can be created or opened by double clicking on the “Component Diagram” area of the domain element in the Main View.
To create a new component, the user may click the “Component” button in the palette, or leave the mouse over an empty area until the pop up window appears. The newly-created component does not have an assigned type, and as such its textual representation is not syntactically valid yet; to select the type, edit its name and press Control+space after the semicolon to invoke content assist to select the desired type, or simply type in its name instead.
By default, new components have an unique timeline, but it’s possible to add more (Timeline button in the palette) if desired; whether this makes sense semantically is another matter.
Timelines have additional properties that cannot be changed from the diagram editor, but require the Properties view instead. These are:
- Type
- the type of the timeline, according to the rules of DDL language.
- Params
- (in the “Semantic” section of the Properties view) some planner-specific values, separated by comma, that characterize the timeline according to the planner rules; KeeN does not check the validity of the identifiers entered.
- External
- if this box is checked the timeline is considered external, that is, its values cannot be decided by the planner. This is a shortcut for adding the “external” string to the timeline parameters.
The Component Diagram has an additional layer that can be shown if needed, the Dependencies layer. Dependencies, shown as dashed lines from the dependent to the dependency, do exist when a component’s value (the dependency) is referenced inside a synchronization starting from the dependent component.
By double-clicking on a timeline, the Synchronization Diagram for that timeline is opened (and created if needed).
The Synchronization Diagram
The Synchronization Diagram is by far the most complex diagram in KeeN: while its simple usage is quite immediate, it can grow in complexity if used at its full extent. A synchronization diagram can be opened or created by double-clicking the timeline it refers to from the component diagram.
This diagram shows a group of synchronizations each originating from the same timeline, and is semantically equivalent to the SYNCHRONIZE group that is defined on a timeline in the DDL language.
When it is created on a previously empty timeline, it shows the possible values that this timeline may assume, taken from the state variable type of the component containing it. To create a synchronization, one of this values must be used to define the trigger, that is, the “head” of the synchronization; it can be created by clicking the “Trigger” button in the palette and then clicking on the desired value, or by leaving the mouse pointer over the desired value and choosing the trigger icon from the windows that pops up. Once created, the trigger is displayed as being an instance-of the chosen value.
To finish creating the synchronization, one (or more) values must be chosen as the target of the synchronization; this can be accomplished by selecting “Synchronization” from the “Create” palette and then selecting the trigger, or by leaving the mouse cursor on the trigger and selecting the appropriate action from the window that pops up. The created constraints are, by default, MEETS, but they can be changed to whatever is legal in the DDL language.
More complex structures are also possible:
- targets can be bound themselves to other values using another constraint: such a situation is depicted in the following figure, between
cd0andcd2, and was created by using the “Synchronization” tool under the “Create” palette on the already-existing targetcd0.
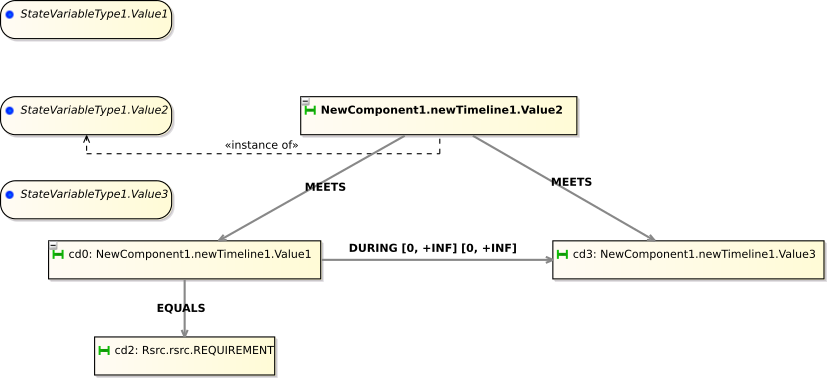
- two already instantiated targets can also be connected by the means of a constraint, using the “Synchronization” tool under the “Connect” toolbar; this allows to express further intertwined constraints besides the most basic ones involving only a pair of values. This is the case of the constraint between
cd0andcd1in above figure.
Finally, a synchronization can be fine-tuned by invoking a specialized editor to directly edit the underlying DDL code: it is enough to select “Constraints” under the “Edit” palette and select the synchronization trigger; moving the mouse over the desired trigger and selecting the appropriate icon in the popup window will also work.
This diagram has three layers: Types, Targets and Dependencies, that are all enabled by default. When hiding types, the blocks representing the values of the state variable types that the triggers are instances of are not shown; when hiding targets only the synchronizations triggers are shown, permitting to visualize a large number of synchronizations while hiding the details.
Instead of using layers, the user might find useful to hide some parts of the synchronization graph by collapsing the desired sub-trees: this can be accomplished by clicking on the expand/collapse button on the top-left corner of the block representing the root of the sub-tree. This action hides all elements connected to the node by outgoing edges, recursively.
Advanced Features
This section presents some of the advanced features of KeeN which were not covered before, or that were previously introduced but are less frequently used, and thus might need a dedicated section to easily stand out.
Properties Accessible Through the Properties View Only
Some properties lack a graphical operation to edit them, and can be changed only using the Properties View on the selected element:
- Controllability (State Variable Values)
- The controllability can be changed on State Variable Values that do not represent sink states (ie, they have at least an outgoing edge in the Transition Constraints Diagram). Values can be selected in the Domain Model or in the Transition Constraints Diagram.
- Timeline Type
- This property can be set on timelines when selected in the Component Diagram.
- External timelines
- A timeline can be marked as external when selected in the Component Diagram
- Timeline Parameters
- The “Params” property is available in the “Semantic” tab of the Properties view, instead of the default “Main” tab as all other properties. This field can be used to specify planner-specific values (separated by comma) related to the timeline; the “External” checkbox introduced above is just a shortcut for adding the “external” identifier to these parameters.
Usage of Menus
Besides the standard action available through the palette and the toolbar, it is almost always possible to perform additional actions by the means of contextual menus that pop up when right clicking on an item. Also, a “Diagram” menu is added to the standard set of Eclipse menus when dealing with diagrams: among other things, it allows to customize a lot of visual aspects of the object displayed, such as font, color, line styles and so on.
Layouts
If needed, it is possible to let Eclipse automatically lay out the diagrams: it can be done by using the “Arrange All” command in the view’s toolbar, or the “Layout the Current Diagram” action in the main Eclipse toolbar. KeeN makes use of different layout algorithms according to the diagram that is selected, but there is no way of customizing this aspect; if this kind of flexibility is needed, the user might want to install the full distribution of the Eclipse Layout Kernel and choose the desired algorithm and parameters. KeeN itself uses ELK for some of the diagrams, but this does not interfere with the ability of using ELK to override KeeN’s settings.
On the other hand, if some manual adjustments to the positioning are required, it might be useful to activate layouting mode (see section The Toolbar) to prevent accidental changes to semantic information; when this is done a message appears in the Eclipse toolbar remembering that this mode is active.
Finally, when changing the positioning determined by algorithmic layouts it is common to find some connector lines having unnecessary bend points; it is possible to remove all bend points, thus making a line straight, by selecting “Remove bend-points” from the contextual menu of the connector, or by pressing the combination Control+Shift+Minus: it is always possible to re-add a bend point later by clicking on the desired position in the connector and dragging the mouse.
Exporting Images
It is possible to generate images of the diagrams to be included in documentation, websites or other publications by using the “Export diagram” button on the view’s toolbar (see section The Toolbar). Before exporting, the amount of details displayed can be fine-tuned by activating/deactivating layers, or by hiding specific elements by the means of the “Show/Hide” button. For better results, it is advised to export the image in a vector format (svg): the generated file can be opened in a vector-graphics editor for further adjustments, and also converted in other popular formats; usually these programs permit to convert the svg file in other vector formats, such as the popular pdf, but they can also be employed for the generation of raster images with a higher resolution than the one of the screen, which is used by default by KeeN when exporting images to raster formats.
Planning
The goal of KeeN is assisting users in developing domains for timeline-based planning, so sooner or later a moment comes when what has been designed must be given as input to a planner to generate some valuable output. In other words, given a domain and a problem description, planning is the act of generating a plan to reach the desired goals by the means of a planner. In KeeN, planning is delegated to the EPSL planner [COU2013,CO2015], or to other planners who share a compatible interface.
Planner Installations
For KeeN to make use of a EPSL installation, it is necessary that the former know where to find the latter. KeeN is not limited to use only a single, specific planner, but it can handle multiple installations instead. For those familiar with Java development in Eclipse, the concept of multiple installations of planners is analogous to the multiple installations of Java virtual machines; this way, it is possible to use different planners for different problems, or to try different planners on the same problems to explore alternative solutions. Even if KeeN supports multiple planners, most users will only need a single planner, which will be used by default when creating new run configurations (see section Run Configurations).
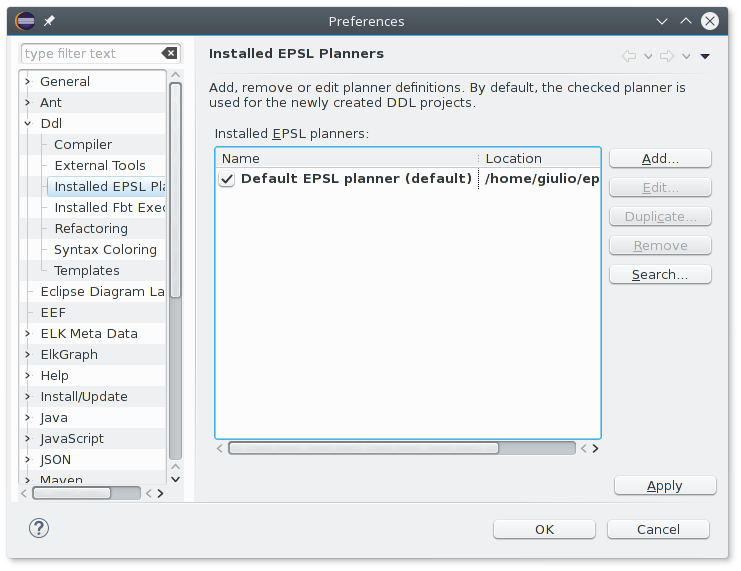
Planners can be added to KeeN at the time a new run configuration is defined, but it is also possible to add them in advance if desired. To add a new planner installation, open the KeeN preferences (see section User Settings) by selecting “Preferences” from the “Window” menu (or “Eclipse” menu if using macOS) and open the section “Installed EPSL Planners” under the “Ddl” category (see next figure). There, planner installations can be added, modified, removed or duplicated. If there were no previous installation, the newly-added planner is marked as being the default; this setting can however be changed at any time (provided there are at least two installations) by ticking the checkbox on the left of the installation name.
Run Configurations
To execute a planner on a set of input files a run configuration is needed. Run configurations specify which are the ddl and pdl files, which planner to use, and optional arguments for the planner.
To create a run configuration, simply click on the “Run As…” button in the main Eclipse toolbar, and if needed choose to run as a “EPSL Planning Problem”. If there was a ddl or pdl file opened in the editor, KeeN will use that file as the domain or problem description file, respectively; most of the times though KeeN is able to locate both the needed files (e.g. in the case they are the only two files in the project, or by guessing the second file name on the basis of the first one), so the planner can be launched straight away by clicking on the Run button without having to adjust any setting further, provided that a default planner has already been installed (see section Planner Installations).
Besides the obvious fields for the two needed files, there is a “Planner arguments” field that can be used to specify additional arguments to the plan command given to the planner (see section Interacting with the Planner). Finally, the “Quit the planner on completion” check box determines if the planner is to be terminated after displaying the plan or if it should be left running, letting the user further interact with it.
When editing run configurations there are additional tabs that can be used to tweak other details:
- EPSL
- This tab is used to select the planner to run. It also provides a shortcut to add, remove or edit planner installations, as explained in section Planner Installations.
- JRE
- Here it’s possible which Java Runtime Environment to use when executing the chosen planner.
- Common
- This section contains some options common to all kind of run configurations in Eclipse. It must be noted that the option “Allocate console” must always be left enabled, otherwise KeeN would not be able to communicate with the planner.
Once all details are set, the planner can be executed by clicking the “Run” button. To launch a planner again with the same parameters, it is enough to select the run configuration name from the drop-down menu at the right of the “Run As…” button in the main Eclipse toolbar.
Interacting with the Planner
When the planner is executed, KeeN initializes it with the given Domain and Problem description files, and instructs it to generate a plan. Once that is done, it asks the planner to display the plan; these actions, and the related commands, are visible in the Console view that is automatically opened when the planner is executed (provided that the “Allocate console” option has not been deactivated, as remarked in section Run Configurations). The Console is also the place where the generated plan is shown in textual form: if the view is too small, it is possible to maximize the console by double-clicking on its tab. When the planner is asked to display the plan, though, it will also open a new window where the latter is displayed graphically, as shown earlier in this guide.
If in the run configuration the option “Quit the planner on completion” was specified, the planner will automatically be terminated when the window displaying the plan is closed; if that option was not used, however, it will be left running for the user to input additional commands. While an accurate description of EPSL is out of the scopes of this text, for which the curious reader is encouraged to refer to the official EPSL documentation, what follows is a summary of the most commonly used commands:
-
helpshows the built-in help. -
init <ddl-file> <pdl-file>initializes the planner from the given files. -
plan [<options>]finds a plan satisfying the goals in the pdl-file, or according to the options if specified. -
displaydisplays the plan. -
export <outputfile>exports the plan in a format suitable for being parsed by Plan2Tiga. -
exitquits the planner.
Executing Plans
If planning is about generating a plan to satisfy some goals, that plan usually also needs to be executed. In some cases an human being can undertake the actions specified in a plan (for instance, if the plan details the moves needed to solve a puzzle or a chess game), but in other situations a software executor is needed.
An executor is usually very specific to the domain of interest, since it must be able to activate the actions that make it possible to alter the environment: and it might reside on a robot, on the local computer or on a remote machine. For all these reasons, it is unlikely that in a production environment an executor would be running on the same machine of KeeN, which is a developer tool. Nevertheless KeeN can make use of executors, since this makes sense during the developing phase and for debugging purposes: the domain developer can model the problem, have a plan generated and test the execution in a controlled or simulated environment, thus being able to further refine the model.
Since executors are so domain-specific, it does not make sense to bundle any of them in KeeN, which is meant to be a general tool. At the time of writing this text an executor does exist for the FourByThree project, but others might be developed as needed.
Executors are handled in KeeN in a way similar to the one planners are: multiple installations can be added, and run configurations can be created to instantiate a specific executor with the desired parameters.
Validation and Verification
An important part of developing is the ability of testing the system being constructed. In some cases though, formal methods can be employed to verify some properties of interest rather than simply testing specific situations in limited scenarios.
KeeN makes use of Uppaal Tiga, a model checking tool based on Timed Game Automata, to perform Domain Validation and Plan Verification.
Domain Validation
Domain Validation is used to check whether the domain was correctly written, with regard to the reachability of each value of each component. For Domain Validation to work, Uppaal Tiga must be installed and KeeN configured to make use of it, as specified in section Post-installation Settings.
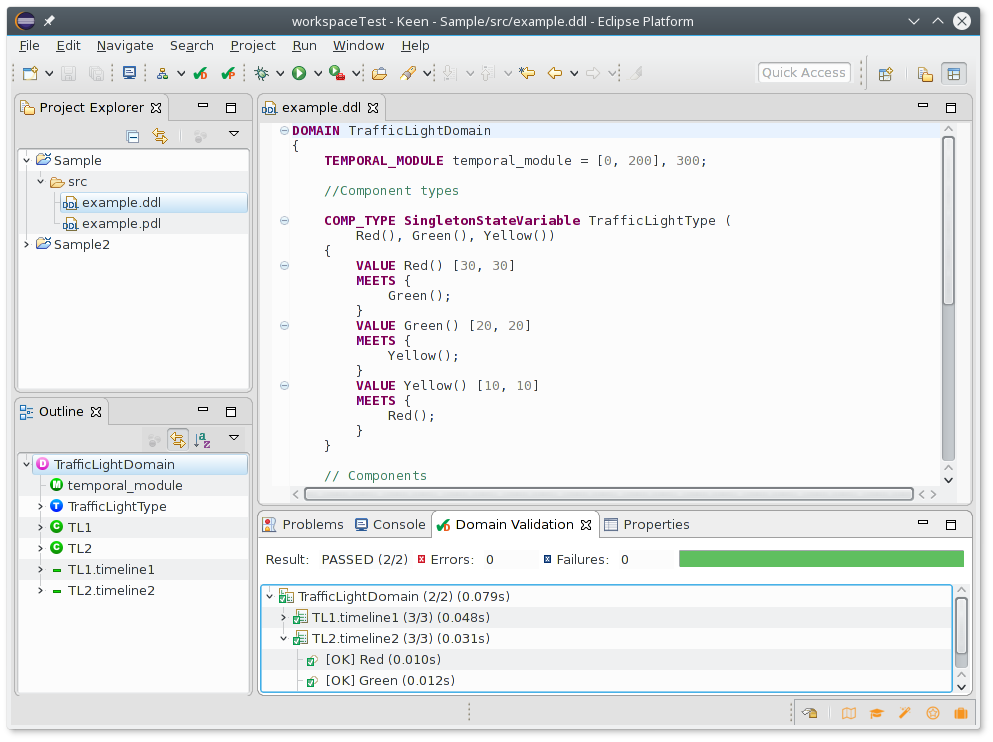
To validate a domain, it is enough to open a ddl file and select the “Validate Domain” action in the main Eclipse toolbar: KeeN will translate the domain in a format suitable for Uppaal Tiga to parse, and it will use the latter to verify the reachability of each value of each component.
After validation is completed, detailed results about each property are shown in the Domain Validation view; those familiar with Java development might recognize it resembles the JUnit view: a green bar means that all properties were correctly verified (that is, all values are reachable), while a red bar means there was at least one failure. In the bottom part, a tree view permits to examine the situation and determine which values could not be verified; in this case the user might decide to revise their model, removing the unreachable value or changing some domain rule so that this value might be reached as originally expected.
Plan Verification
Plan Verification is about formally verifying that a time-flexible plan can always lead to the desired goal, regardless of the external events (external timelines and uncontrollable values). To achieve this, the plan is modeled as a two-player game where one player is the environment, and the other is the planner trying to reach the specified goal [CO2015]. This situation, encoded as a network of Timed-Game Automata (TGA) by Plan2Tiga, is then given to Uppaal Tiga: if it is not able to find a strategy where the environment wins against the planner, the plan is verified.
For Plan Verification to work, both Uppaal Tiga and Plan2Tiga must be installed and made visible to KeeN (see section Post-installation Settings). To verify a plan, it is first necessary that a run configuration with the desired set of input files, planner and optional parameters do exists: this has been explained in section Run Configurations, but most of the times just pressing the “Run” button is enough to create an acceptable configuration. After a run configuration has been created, it is enough to click on the “Verify Plan” in the main Eclipse toolbar: the planner will be executed to generate a plan, which will be translated by Plan2Tiga and then verified by Uppaal Tiga; finally, KeeN notifies the user with a message box about the result of the operation.